Chief Executive Recruitment
Westmorland and Furness Council

About the Council
Our Stats
Further Reading
Our Stats
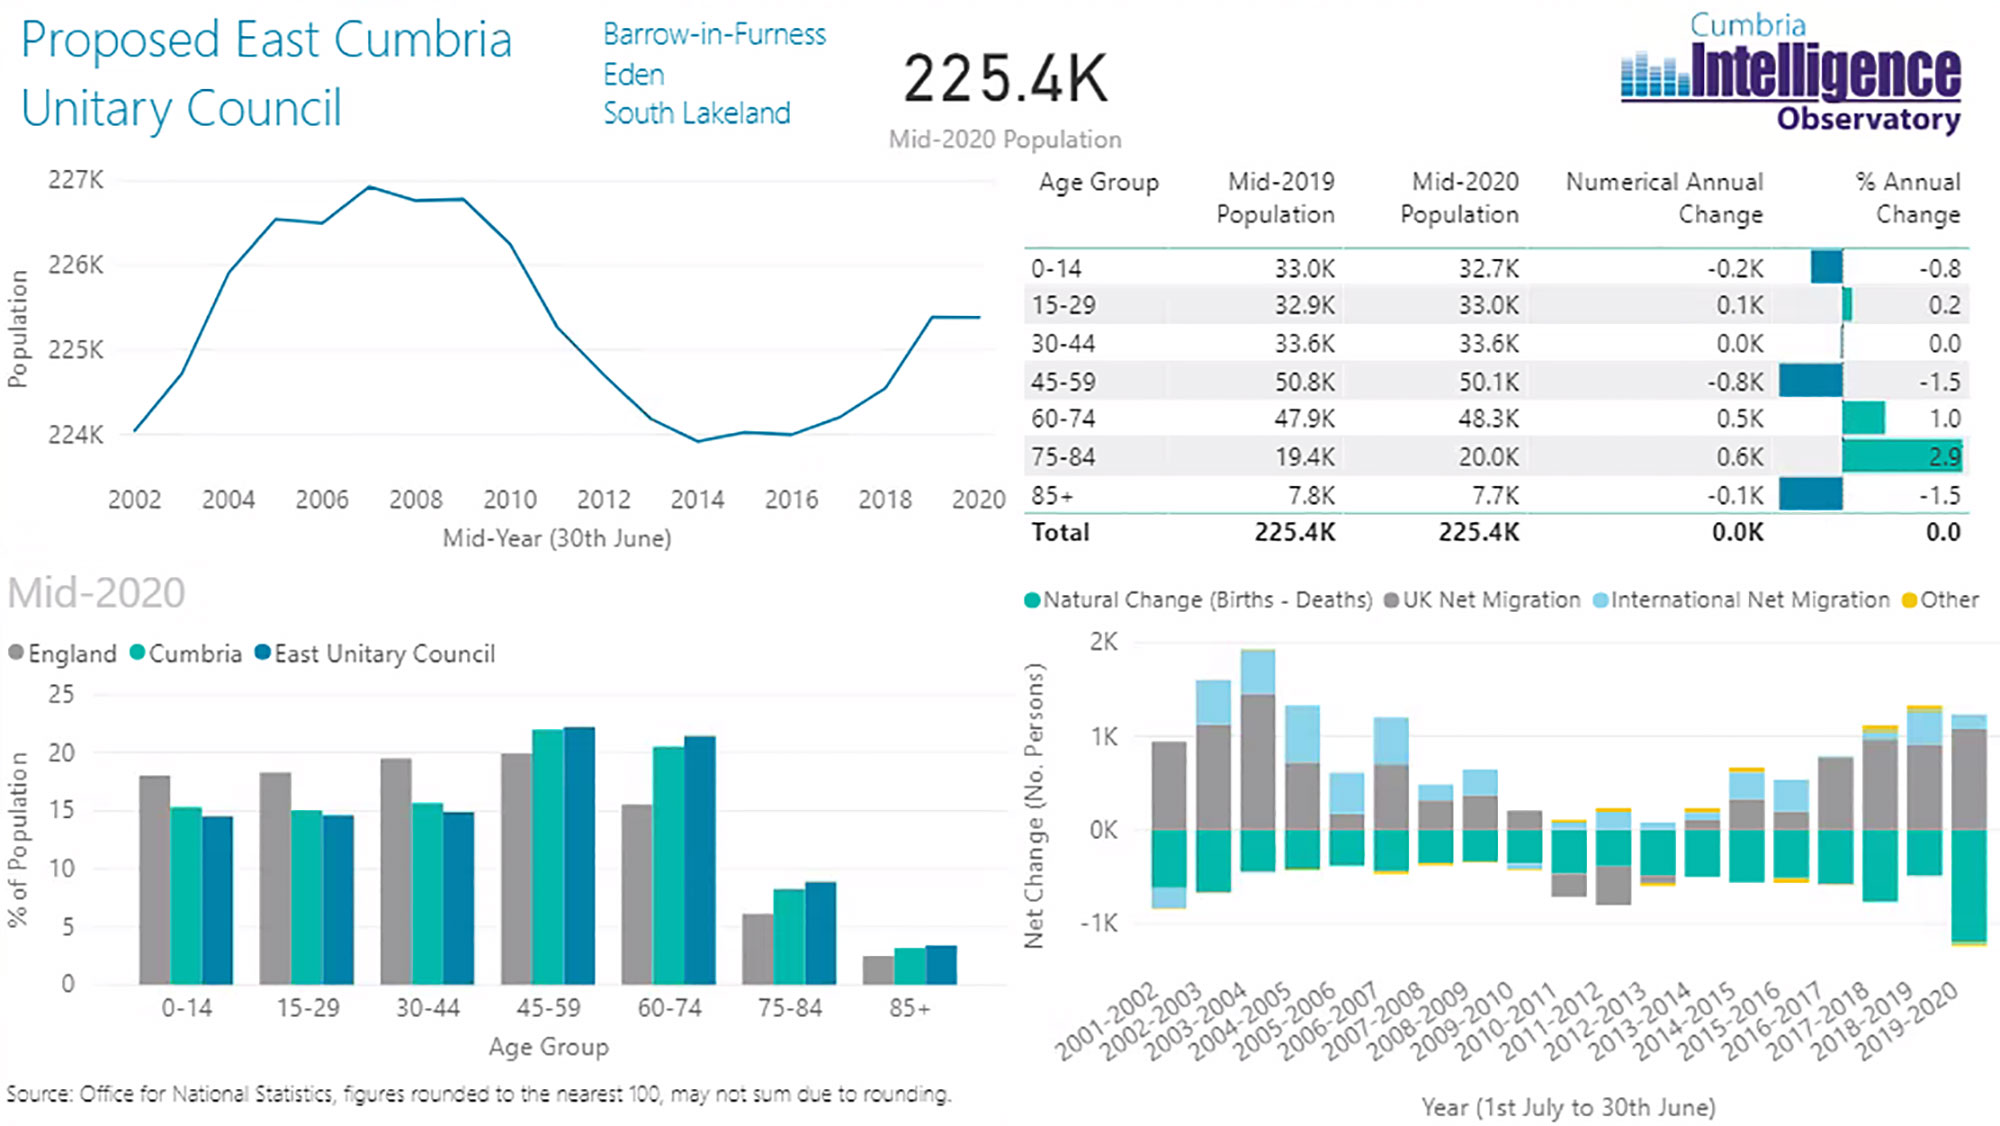
Population: 225,400 persons; a decrease of 0.4% over the last decade. 15.6% of the population are aged 0-15 years (lower than the national average of 19.2%), while 26.3% of the population are aged over 65 years (higher than the national average of 18.5%).
By 2028 the population of Westmorland and Furness is projected to increase (+1.1% vs. England +5%) and become older; with numbers of 0-15 and 16-64 year olds projected to decrease by 5.5% and 3.5% respectively (England -1.6% and +2.7%), while numbers of people aged 65+ are set to increase by 15.5% (England +19.6%).
There are 114,000 jobs at workplaces in Westmorland and Furness.
The public administration, education and health sector accounts for the greatest proportion (24%), followed by wholesale & retail (18%), manufacturing (15%) and accommodation & food services (14%). The median annual household income in Westmorland and Furness is estimated to be £34,638; lower than the national average (£37,436). The unemployment rate is below the national average (2.3% vs. 4.0%). 33.9% of residents in Westmorland and Furness are estimated to be qualified to level 4 or higher, below the national average (43.5%); this is in part due to the sector and occupational profile of employment in the area.
20% of residents in Westmorland and Furness report their day-to-day activities are limited because of an illness or disability, higher than the national average (18%). Public Health England (PHE) report that Westmorland and Furness has worse rates than the national average in relation to emergency hospital admissions for heart attack, hospital stays for self-harm and deaths from stroke. However, Westmorland and Furness performs better than the national average in relation to: hospital admissions for all causes; emergency hospital admissions for Chronic Obstructive Pulmonary Disease; incidence of cancer; deaths from all causes; deaths from cancer; deaths from circulatory disease in under 75s; deaths from respiratory diseases; and deaths from causes considered preventable in under 75s.
15% of children in Westmorland and Furness live in relative low-income families. While this is lower than the national average (18.7%), there are some wards where levels of child poverty are much higher than the national average; the proportion of children in relative low-income families is more than one and a half times the national average in the wards of Ravenstonedale, Central, Hindpool, Barrow Island and Warcop. 12 communities (LSOAs) in Westmorland and Furness fall within the 10% most deprived of areas in England; these communities are all located within Barrow-in-Furness. It is generally in these deprived areas that unemployment and crime rates are higher, while household incomes and educational attainment are lower and health outcomes can be poor. Inversely, Westmorland and Furness has 6 LSOAs that are classified as being in the 10% least deprived of LSOAs nationally; these LSOAs are all located in South Lakeland.
A map plotting deprivation across Cumbria can be found here: https://www.cumbriaobservatory.org.uk/deprivation/map/

